PCoA.py
Create a series of 2D or 3D PCoA plots where the marker size varies by relative abundance of a particular OTU.
usage: PCoA.py [-h] -i COORD_FP -m MAP_FP -b COLORBY [-o OUT_FN] [-d {2,3}][-t TITLE] [--save] [-c MAP_CATEGORIES] [-s POINT_SIZE]
Required Arguments
-
-iCOORD_FP,--coord_fpCOORD_FP¶ Input principal coordinates filepath (i.e., resulting file from principal_coordinates.py).
-
-mMAP_FP,--map_fpMAP_FP¶ Input metadata mapping file-path.
-
-bCOLORBY,--colorbyCOLORBY¶ Metadata categories (column headers) to color by in the plots.
Optional Arguments
-
-d{2,3},--dimensions{2,3}¶ Choose whether to plot 2D or 3D.
-
-cCOLORS,--colorsCOLORS¶ A file containing user defined colors in hex values or matplotlib named colors, each on separate line. If user color list is not sufficient or ont defined, program will use Qualitative Set1 scheme from brewer colors. More information on matplotlib named colors.
-
-sPOINT_SIZE,--point_sizePOINT_SIZE¶ Specify the size of the circles representing each of the samples in the plot.
-
--pc_orderPC_ORDER¶ Choose which Principle Coordinates are displayed and in which order, for example: 1,2 (Note the lack of any spaces around the comma).
-
--x_limitsX_LIMITS X_LIMITS¶ Specify limits for the x-axis instead of automatic setting based on the data range. Should take the form: –x_limits -0.5 0.5
-
--y_limitsY_LIMITS Y_LIMITS¶ Specify limits for the y-axis instead of automatic setting based on the data range. Should take the form: –y_limits -0.5 0.5
-
--z_limitsZ_LIMITS Z_LIMITS¶ Specify limits for the z-axis instead of automatic setting based on the data range. Should take the form: –z_limits -0.5 0.5
-
-tTITLE,--titleTITLE¶ Title of the plot.
-
--dpiDPI¶ Set plot quality in Dots Per Inch (DPI). Larger DPI will result in larger file size.
-
-oOUT_FP,--out_fpOUT_FP¶ The path and file name to save the plot under. If specified, the figure will be saved directly instead of opening a window in which the plot can be viewed before saving.
-
-h,--help¶ Show the help message and exit.
Workflow for generating PCoA plots using PhyloToAST
Step 1 : Obtain unifrac principal coordinates file from QIIME’s beta_diversity_through_plots.py script.
Step 2 :
Run PCoA.py script with -t Path to the tree file parameters.
Example plots
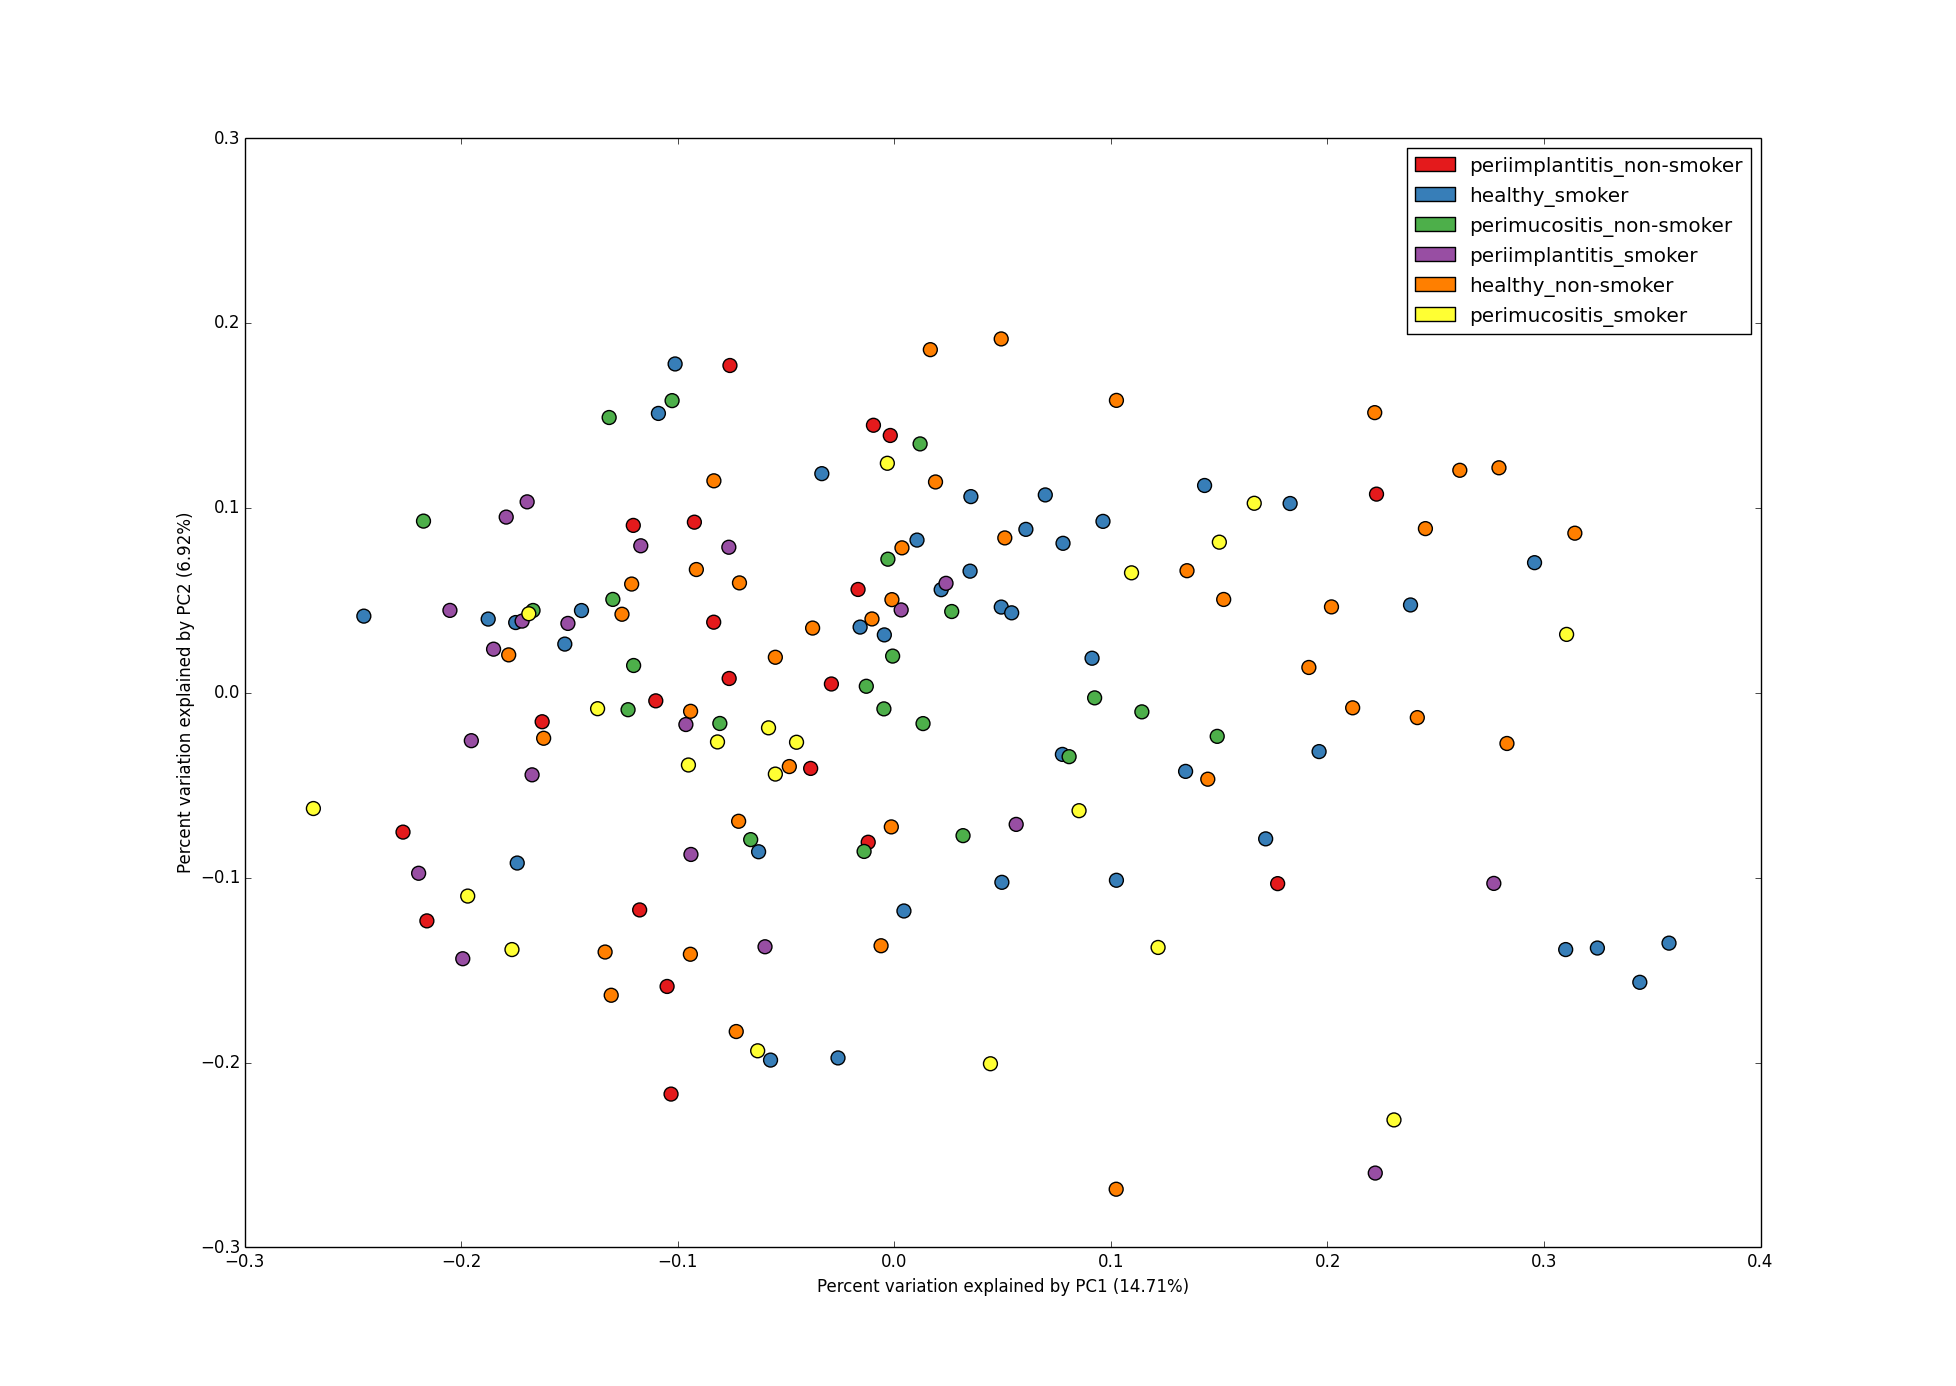
2D PCoA plot with 2 metadata categories - DiseaseState and SmokingStatus.
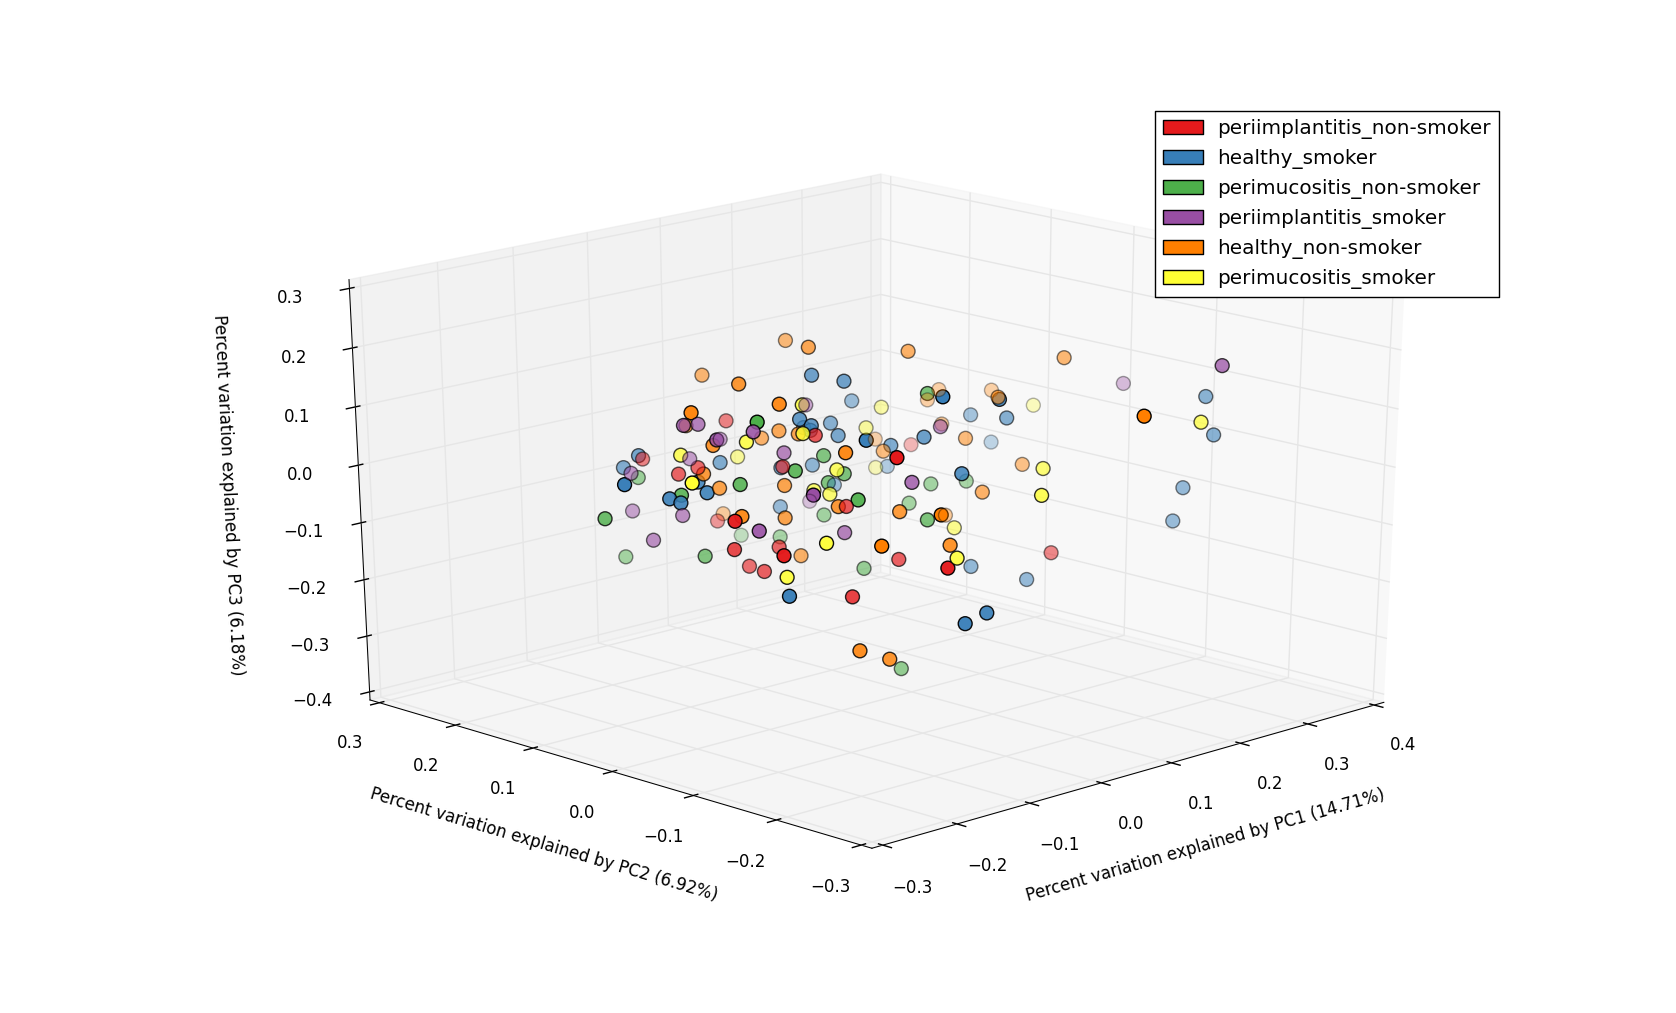
3D PCoA plot with 2 metadata categories - DiseaseState and SmokingStatus.