LDA.py
This script calculates and returns LDA plots based on normalized relative abundances or distance matrices (for e.g. unifrac distance matrix).
usage: LDA.py [-h] -m MAP_FP -g GROUP_BY [-c COLORS] [-ot OTU_TABLE] [-dm DIST_MATRIX_FILE] [--save_lda_input SAVE_LDA_INPUT] [--plot_title PLOT_TITLE] [-o OUT_FP] [-d {2,3}] [--z_angles Z_ANGLES Z_ANGLES] [--figsize FIGSIZE FIGSIZE] [--font_size FONT_SIZE] [--label_padding LABEL_PADDING] [--annotate_points] [--ggplot2_style]
Required arguments
-
-mMAP_FP,--map_fpMAP_FP¶ Metadata mapping file.
-
-gGROUP_BY [GROUP_BY ...],--group_byGROUP_BY [GROUP_BY ...]¶ A column name in the mapping file containing categorical values that will be used to identify groups. Each sample ID must have a group entry. Default is no categories and all the data will be treated as a single group.
Optional arguments
-
-cCOLORS,--colorsCOLORS¶ A column name in the mapping file containing hexadecimal (#FF0000) color values that will be used to color the groups. Each sample ID must have a color entry.
-
-otOTU_TABLE,--otu_tableOTU_TABLE¶ Input biom file format OTU table.
-
-dmDIST_MATRIX_FILE,--dist_matrix_fileDIST_MATRIX_FILE¶ Input distance matrix file.
-
--save_lda_inputSAVE_LDA_INPUT¶ Save a CSV-format file of the transposed LDA-input table to the file specifed by this option.
-
--plot_titlePLOT_TITLE¶ Plot title. Default is no title.
-
-oOUT_FP,--out_fpOUT_FP¶ The path and file name to save the plot under. If specified, the figure will be saved directly instead of opening a window in which the plot can be viewed before saving.
-
-d{2,3},--dimensions{2,3}¶ Choose whether to plot 2D or 3D.
-
--z_anglesZ_ANGLES Z_ANGLES¶ Specify the azimuth and elevation angles for a 3D plot.
-
--figsizeFIGSIZE FIGSIZE¶ Specify the ‘width height’ in inches for LDA plots. By default, figure size is 14x8 inches.
-
--font_sizeFONT_SIZE¶ Sets the font size for text elements in the plot.
-
--label_paddingLABEL_PADDING¶ Sets the spacing in points between the each axis and its label.
-
--annotate¶ If specified, each data point will be labeled with its sample ID. Currently, only works for 2D plots. Default is False.
-
--ggplot2_style¶ Apply ggplot2 styling to the figure. Default is False.
-
-h,--help¶ Show the help message and exit.
Workflow for generating LDA plots using PhyloToAST
Step 1 : Create an all-pairs distance matrix for your sample data using the beta_diversity.py QIIME script. Different distance metrics can be calculated here: bray_curtis, morisita_horn, kulczynski, and many others.
Step 2 :
Users can use either diversity distance matrix file or BIOM format file to run LDA.py script with all relevant parameters. If a distance matrix file is provided, LDA will use the distance matrix as an input, otherwise it will calculate OTU relative abundances from input BIOM format file and run LDA based on OTU relative abundances.
Example plots
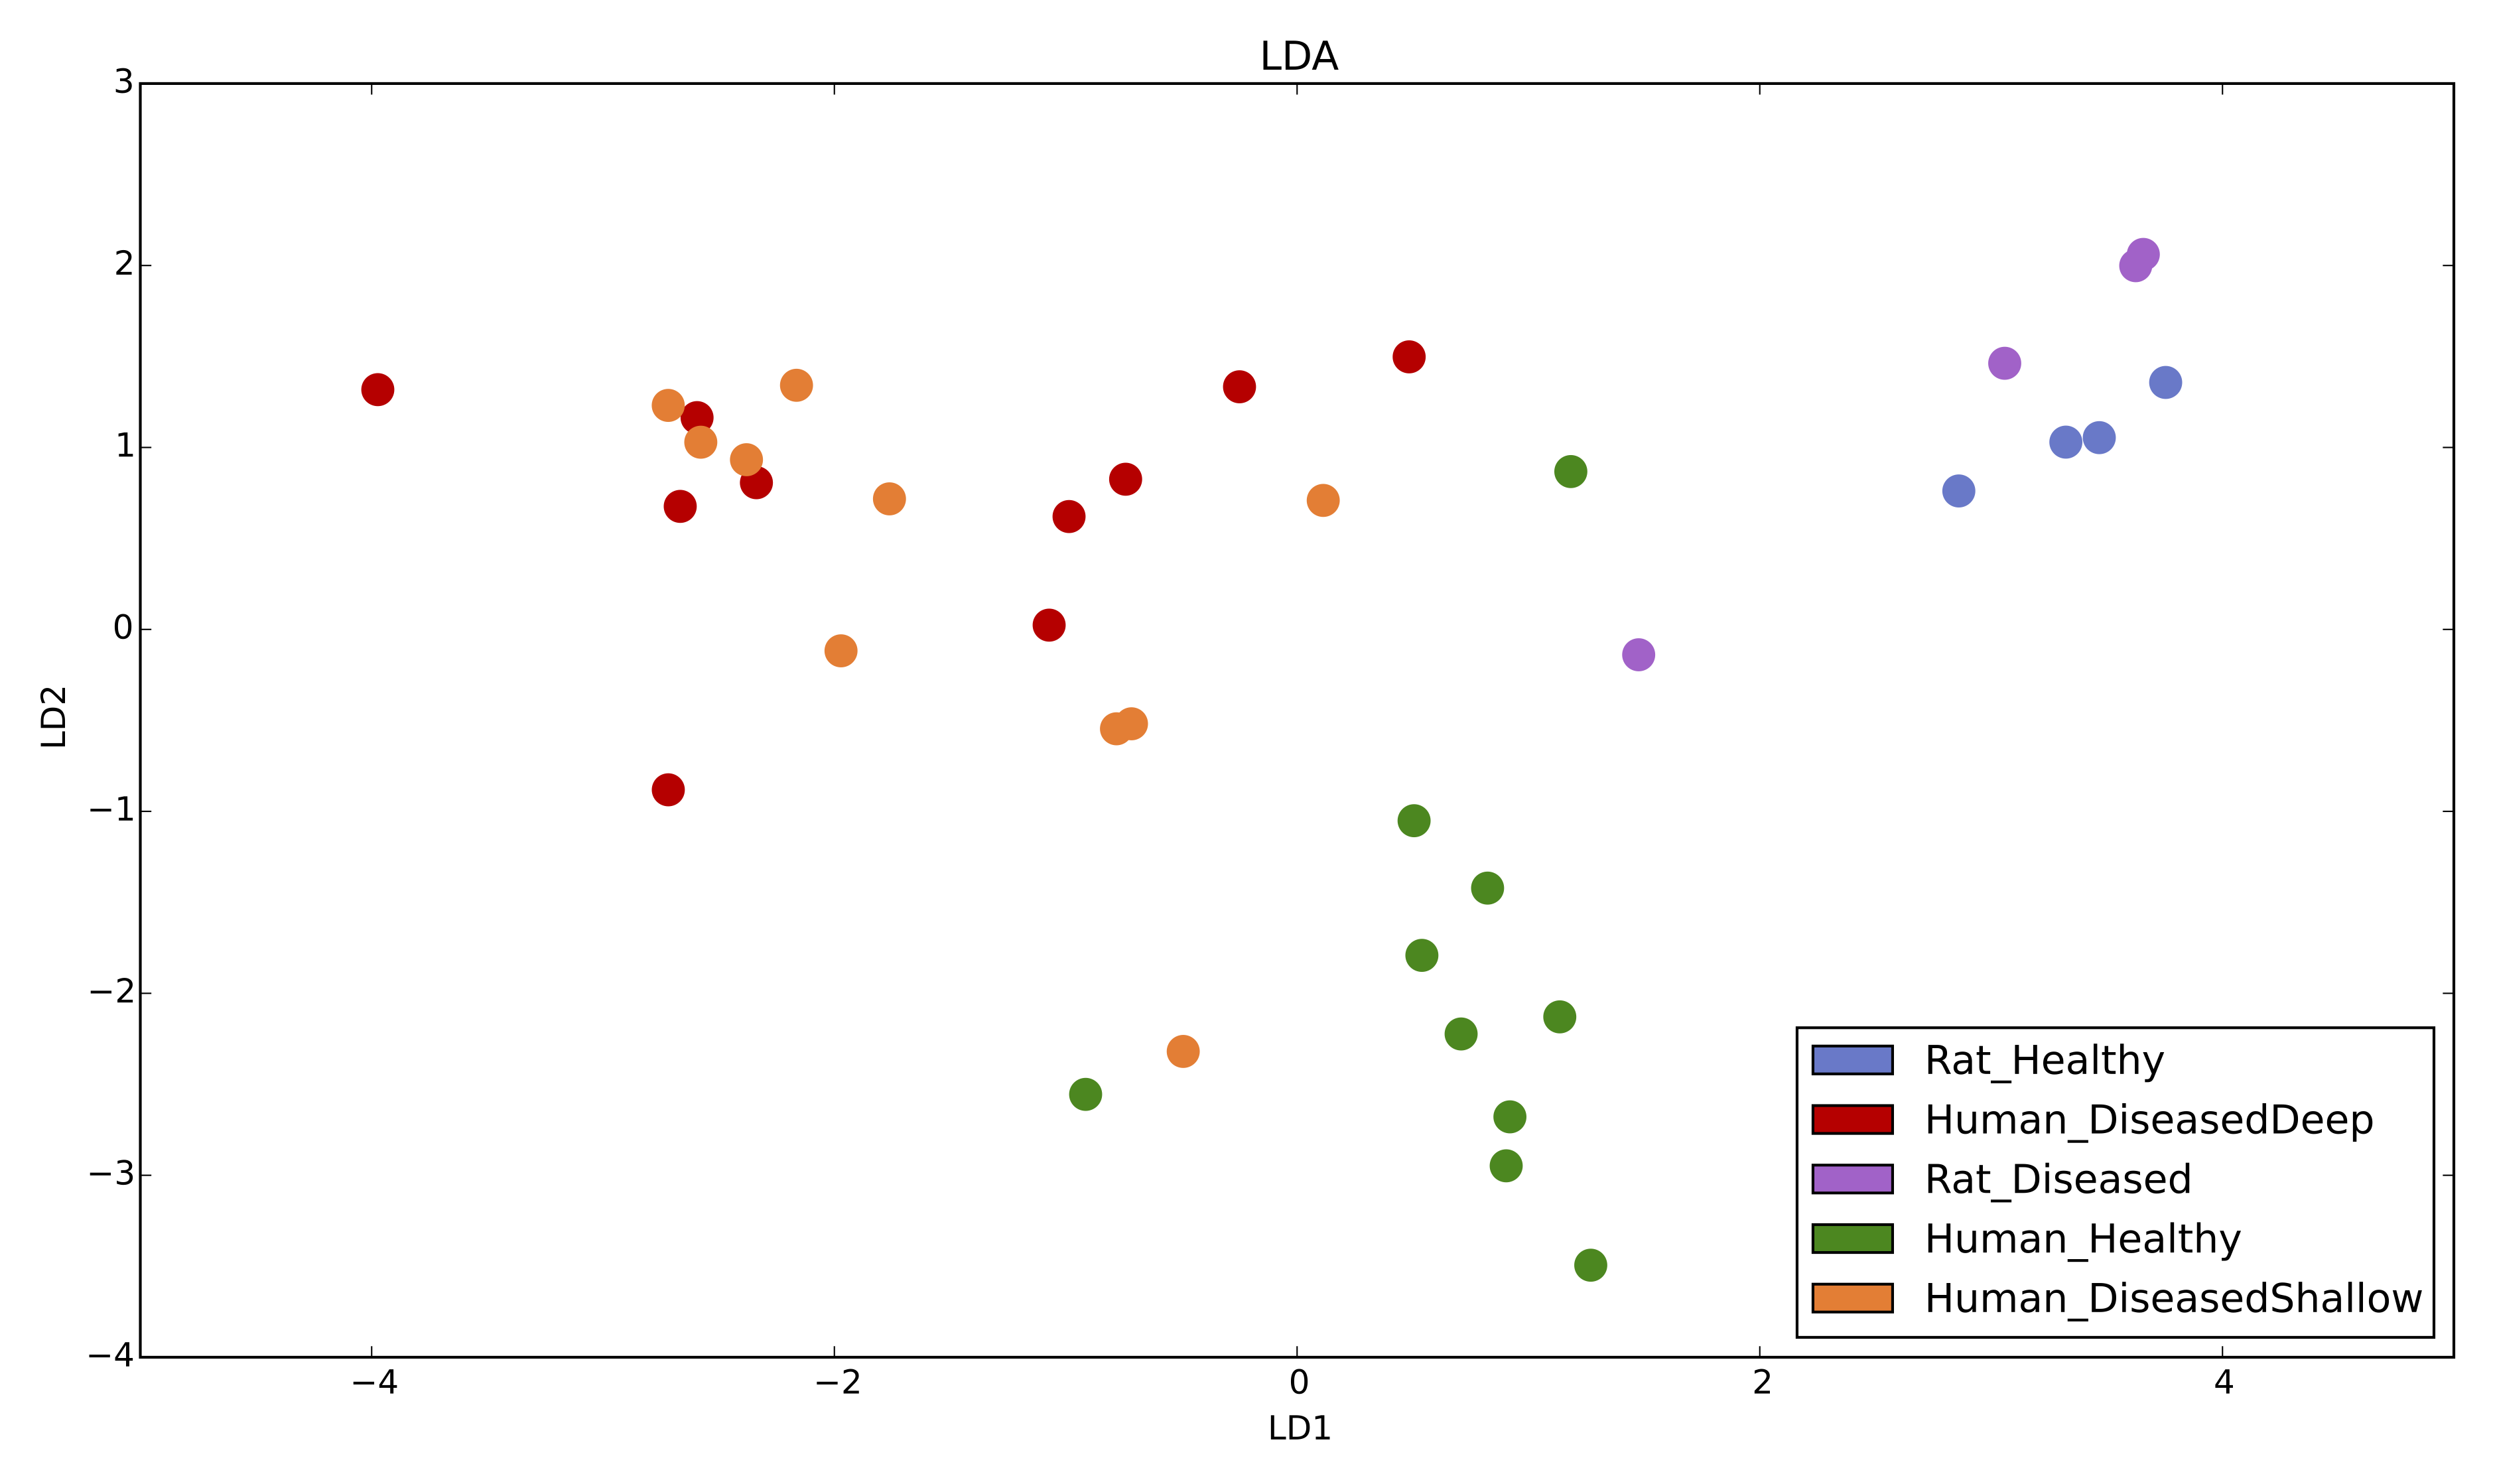
2D LDA plot based on relative abundances with 5 metadata categories [1].
LDA.py -i table.biom -m mapping.txt -g Condition -c Colors
Citation:
| [1] | Dabdoub, S. M. et al. PhyloToAST: Bioinformatics tools for species-level analysis and visualization of complex microbial datasets. Sci. Rep. 6, 29123; doi: 10.1038/srep29123 (2016). |